The Triple Threat, Extended: Angular Code Coverage from the Same Playwright Tests
Overview
This post is a direct follow-up to TUnit, Aspire, and Playwright: A Powerful Triple Threat for Automated Testing and Agentic Workflows. If you haven't read that one yet, start there -- everything about TUnit, Aspire, and the overall test project layout still applies. This post covers what changed (and what got added) when the Razor Pages front end was replaced with Angular and a Duende Backend-For-Frontend (BFF).
The original "triple threat" repo used Razor Pages for its UI, which meant the coverage
story was simple: everything under test was .NET, so a --coverage flag and ReportGenerator
were the whole answer. What happens when the front end is a real single-page app (with a BFF; the BFF is not required, just highly recommended for good security) instead?
That question is what
automated-testing-aspire-angular
answers. It's the same CarvedRock Fitness application and the same TUnit/Aspire/Playwright
test suite -- but the Razor Pages web app has been replaced with an Angular front end
sitting behind a Duende BFF (backend-for-frontend),
and the Playwright browser tests that already exercise that UI have been taught to also
report code coverage for the Angular TypeScript source -- merged into the exact same
reportgenerator HTML report as the .NET projects.
The awesome part: this required zero changes to how the tests are written. The
WebAppTests still just drive Chromium through the app with TUnit.Playwright. Coverage
capture happens underneath them, opt-in, and outside the test author's way.
What's Actually New Here
Three things changed relative to the original repo:
- The web front end is now
ui-with-bff-- an Angular app -- instead of Razor Pages, backed by a Duende BFF that handles the OIDC login and proxies API calls. - A
BrowserCoverageCollectorattaches to each Playwright-driven Chromium page over the Chrome DevTools Protocol and records precise V8 coverage for the Angular bundles the dev server serves. - A small Node script (
ui-with-bff/e2e-coverage.mjs) turns that raw V8 data into a Cobertura report, using source maps to walk the coverage back onto the original.tsfiles -- andtest-with-coverage.ps1/ the CI pipeline hand that file toreportgeneratorright alongside the .NET cobertura files.
The result, after a full ./test-with-coverage.ps1 -ShowReports run against this repo
today:
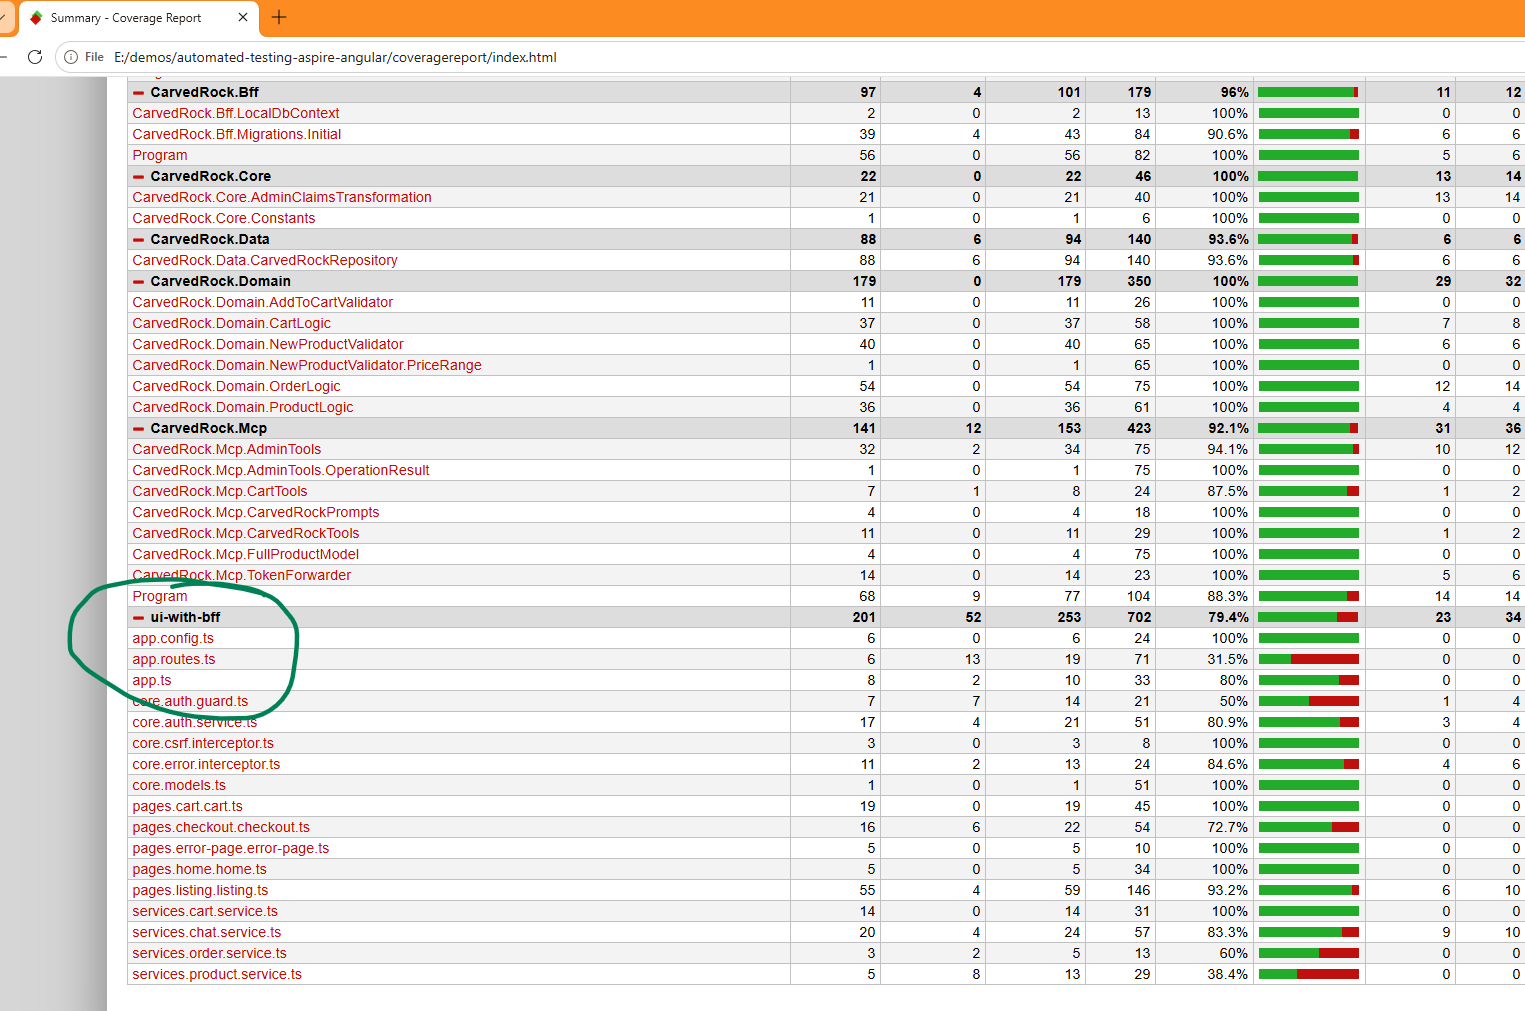
ui-with-bff shows up as its own assembly, next to CarvedRock.Api,
CarvedRock.Bff, CarvedRock.Mcp, and the rest -- one number, one report, covering
both sides of the stack from the same test run.
Getting There: Capture, Convert, Merge
Getting coverage out of a browser is a fundamentally different problem than getting it
out of a .NET process -- there's no --coverage flag for Chromium. It comes down to three
steps.
1. Capture -- precise V8 coverage over a raw CDP session
Playwright's built-in page.coverage API only gives you JavaScript-level coverage, and
even then it can't map that back onto TypeScript source on its own. So
BrowserCoverageCollector talks to Chrome DevTools Protocol directly:
 1public static async Task<BrowserCoverageCollector?> StartAsync(
 2    IPage page, string browserName, string originPrefix, string testName)
 3{
 4    var outputDirectory = OutputDirectory; // set from E2E_COVERAGE_DIR
 5
 6    if (string.IsNullOrWhiteSpace(outputDirectory)
 7        || !string.Equals(browserName, "chromium", StringComparison.OrdinalIgnoreCase))
 8    {
 9        return null; // opt-in, and Chromium-only -- the profiler is a CDP feature
10    }
11
12    var session = await page.Context.NewCDPSessionAsync(page);
13    var collector = new BrowserCoverageCollector(session, page, originPrefix, outputDirectory, testName);
14
15    await collector.StartRecordingAsync(); // Debugger.enable + Profiler.startPreciseCoverage
16
17    return collector;
18}
Two details matter a lot here:
- Collection is opt-in, gated on an
E2E_COVERAGE_DIRenvironment variable. An ordinarydotnet testdoesn't pay for any of this -- onlytest-with-coverage.ps1(and the CI pipeline) set the variable. - Source text for each script has to be cached as it's parsed
(
Debugger.scriptParsed), not after the test ends -- once the page navigates away, the previous document's scripts can no longer be read back, even though the V8 profiler still reports coverage for them.
Wiring it into a test is two [Before(Test)]/[After(Test)] hooks on the shared
CustomPageTest base class -- the same base class every WebAppTests browser test
already inherits from:
 1private BrowserCoverageCollector? _coverage;
 2
 3[Before(Test)]
 4public async Task StartCoverage(TestContext testContext) =>
 5    _coverage = await BrowserCoverageCollector.StartAsync(
 6        Page, BrowserName, WebAppUrl, testContext.Metadata.TestName);
 7
 8[After(Test)]
 9public async Task StopCoverage()
10{
11    if (_coverage is not null)
12    {
13        await _coverage.StopAndWriteAsync();
14    }
15}
Each test that runs while E2E_COVERAGE_DIR is set drops one JSON file into
TestResults/e2e-v8-coverage/ -- raw V8 byte ranges plus the cached source and source-map
URL for every script served from the app's own origin.
2. Convert -- raw V8 coverage to Cobertura, via source maps
monocart-coverage-reports does
the heavy lifting in ui-with-bff/e2e-coverage.mjs: it walks those raw byte ranges back
through each script's source map onto the original .ts files, and merges every test's
contribution into one coverage result.
 1const report = new CoverageReport({
 2  name: 'Angular UI (Playwright browser tests)',
 3  outputDir,
 4  reports: [
 5    ['cobertura', { file: COBERTURA_FILE, projectRoot: repoRoot }],
 6    'console-summary',
 7  ],
 8
 9  // "flat" instead of the default "nested" -- one assembly for the whole Angular app
10  // instead of one per source folder.
11  defaultSummarizer: 'flat',
12
13  // Source maps also carry Vite-optimized third-party bundles and compiled component
14  // templates. Only the app's own TypeScript is worth reporting on.
15  sourceFilter: (sourcePath) =>
16    sourcePath.includes('/src/app/')
17    && sourcePath.endsWith('.ts')
18    && !sourcePath.endsWith('.spec.ts'),
19});
20
21for (const file of files) {
22  const entries = JSON.parse(fs.readFileSync(path.join(inputDir, file), 'utf8'));
23  await report.add(entries);
24}
25
26await report.generate();
A little cleanup happens after generate() too: istanbul's Cobertura writer hardcodes the
flat package's name to "main" and names each class after the bare filename -- which
collides badly once folders are flattened (there's more than one service.ts and
component.ts in this app). The script rewrites both from the real file path, so
cart.ts and checkout.ts end up named pages.cart.cart and pages.checkout.checkout
in the report instead of colliding as cart and checkout.
The output lands at TestResults/frontend-e2e-coverage/frontend-e2e.cobertura.xml --
just another cobertura file, sitting next to the ones dotnet test --coverage produced.
3. Merge -- one glob, one report
This is the part that makes the whole thing feel almost anticlimactic: reportgenerator
doesn't know or care that one of its inputs came from a browser instead of the CLR. Widen
the glob from TestResults/*.cobertura.xml to TestResults/**/*.cobertura.xml, and the
Angular report merges in for free:
 1$env:E2E_COVERAGE_DIR = Join-Path $PSScriptRoot 'TestResults\e2e-v8-coverage'
 2
 3dotnet test --coverage --coverage-output-format cobertura --coverage-settings testconfig.json
 4
 5# Maps the raw V8 byte ranges back onto TypeScript via source maps, writing
 6# TestResults/frontend-e2e-coverage/frontend-e2e.cobertura.xml for the merge below.
 7if (Get-Command node -ErrorAction SilentlyContinue) {
 8    node (Join-Path $PSScriptRoot 'ui-with-bff\e2e-coverage.mjs')
 9}
10
11reportgenerator -reports:"TestResults/**/*.cobertura.xml" -targetdir:coveragereport -reporttypes:"Html;TextSummary;"
The CI pipeline gets the same three-line treatment: set E2E_COVERAGE_DIR, run the
conversion script right after dotnet test (with if: always(), same as every other
reporting step in the original pipeline), and widen the reports: glob passed to the
ReportGenerator GitHub Action. Nothing else about the pipeline -- the PR comment, the
build-summary publish, the combined artifact upload -- had to change at all.
Why This Matters
The point of the original triple-threat setup was a testing framework good enough that an
AI coding agent could plan a feature, implement it, run the whole distributed app for real,
and hand back a coverage number and a video as evidence. Angular front ends are extremely
common, and "sorry, coverage only works for the .NET half" would have been a real gap in
that story -- an agent (or a person) reviewing a PR that touches listing.ts deserves to
see the same red/green line highlighting they'd get for a C# controller.
Now they do. The merged report treats a .ts file exactly like a .cs file: drill in, see
covered and uncovered lines, and decide whether the gap is acceptable -- all from the same
report, produced by the same script, in the same test run that already drives the browser
through the app.
Wrapping Up
Nothing about TUnit, Aspire, or the core Playwright setup from the original post changed. What got added was a narrow, opt-in slice of plumbing -- a CDP-based coverage collector, a source-map-aware conversion script, and a wider glob -- and the payoff is a single coverage report that spans an entire distributed application, front end included.
The full working repo is at dahlsailrunner/automated-testing-aspire-angular.