Code Coverage Reports for .NET Projects
Overview
My last 3 posts were all about writing good integration tests for your ASP.NET Core API projects.
But how much of your code do the tests you've written actually cover? And what's missing?
The code I used as a reference for this article is in the same repo as the previous posts I did about integration testing, and the coverage reporting is done in the 4-api-with-postgres-and-auth repo.
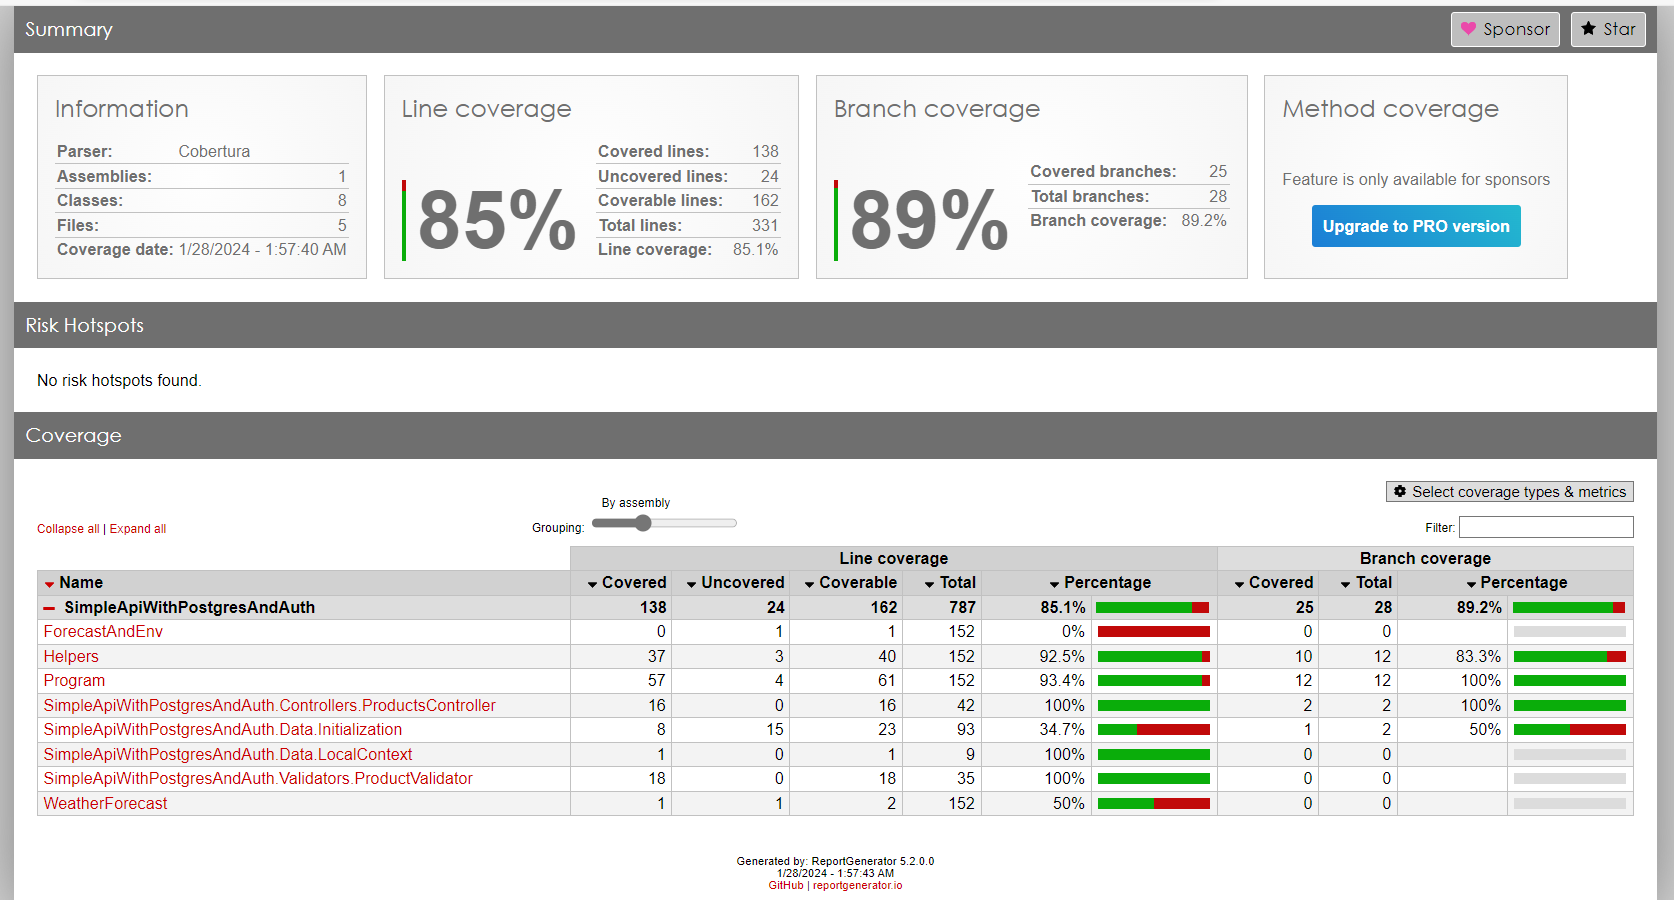
This post will show you how to create a code coverage report like the one shown below using some easy-to-use tools.
Summary
Generate a coverage report locally with the following commands:
1dotnet test --settings tests.runsettings
2reportgenerator -reports:".\**\TestResults\**\coverage.cobertura.xml" -targetdir:"coverage" -reporttypes:Html
3.\coverage\index.htm
The final line above just launches the generated report in a browser.
Further explanation follows, along with how to get some coverage information into automated pipelines - in both GitHub and Azure DevOps!
Setup
The tools that help make the magic happen are the following:
- The coverlet.collector NuGet package
- A
tests.runsettingsfile
- A
- The reportgenerator dotnet tool
- The tests we've already written
Assuming you've got an API and some integration tests, you should be able to
run dotnet test in your solution directory and it should run the tests
properly.
Create a .runsettings file
There are many command line options you can pass to dotnet test, but I've found
that using a .runsettings file is easier.
Here's a starting point (we'll be adding more later) for a tests.runsettings file
in the root directory of the solution:
 1<?xml version="1.0" encoding="utf-8" ?>
 2<RunSettings>
 3  <DataCollectionRunSettings>
 4    <DataCollectors>
 5      <DataCollector friendlyName="XPlat code coverage">
 6        <Configuration>
 7          <Format>cobertura,opencover</Format>
 8        </Configuration>
 9      </DataCollector>
10    </DataCollectors>
11  </DataCollectionRunSettings>
12</RunSettings>
The above runsettings file just indicates that we want to capture "cross-platform" code coverage (meaning this will work on Windows or Mac or Linux).
Run dotnet test to generage coverage details
Then we can modify the dotnet test command to be:
1dotnet test --settings tests.runsettings
The above command will create a cobertura.xml file (as well as an
opencover.xml file) that can be used as an input to the report
generation process.
You don't actually need the opencover version of the coverage
file to do what I'm describing here. There are lots of options
and this post is meant to get you started with a real solution
that works and show the moving parts so that you can configure them
to your needs.
The default location for the xml files that get created
are a subfolder called TestResults for each of the test projects
that get executed.
Use reportgenerator to Generate the Coverage Report
The reportgenerator is a global tool that can read the coverage XML file (more
than one to merge them) and create HTML reports that are super easy to read.
To install the tool:
1dotnet tool install -g dotnet-reportgenerator-globaltool
Once that's installed, you can create the report pretty easily:
1reportgenerator \
2    -reports:".\**\TestResults\**\coverage.cobertura.xml" \
3    -targetdir:"coverage" \
4    -reporttypes:Html
The reports arg (all of the above is a single command) specifies the path
to your coverage files - use wildcards like I've done if you have more
than one test coverage file to merge. If you don't have more than one
test project you can be more explicit in the filename.
The targetdir parameter is required and indicates where the report
will be placed (note that there are a number of files that are part
of the report, so you probably want some directory like coverage).
There are many types of reports available but Html is a good place
to start.
Here's a list of the report formats from the docs, which you can separated by semicolon: Badges, Clover, Cobertura, CsvSummary, MarkdownSummary, MarkdownSummaryGithub, MarkdownDeltaSummary, OpenCover, Html, Html_Light, Html_Dark, Html_BlueRed, HtmlChart, HtmlInline, HtmlSummary, Html_BlueRed_Summary, HtmlInline_AzurePipelines, HtmlInline_AzurePipelines_Light, HtmlInline_AzurePipelines_Dark, JsonSummary, Latex, LatexSummary, lcov, MHtml, SvgChart, SonarQube, TeamCitySummary, TextSummary, TextDeltaSummary, Xml, XmlSummary
The command above will generate coverage/index.htm (or in a different
subdirectory if you provided a different one) that is shown in the screenshot
above.
Explore away!
Feel free to experiment with other report formats.
Excluding Items from Coverage
With slight modifications to the .runsettings file, you can exclude things
like auto-properties and EF Core migrations from your coverage reporting, which
can give you more accurate coverage results.
Here's a modified .runsettings file:
 1<?xml version="1.0" encoding="utf-8" ?>
 2<RunSettings>
 3  <DataCollectionRunSettings>
 4    <DataCollectors>
 5      <DataCollector friendlyName="XPlat code coverage">
 6        <Configuration>
 7          <Format>cobertura,opencover</Format>
 8          <Exclude>[*.Tests?]*</Exclude> <!-- [Assembly-Filter]Type-Filter -->
 9          <ExcludeByFile>**/Migrations/*.cs,</ExcludeByFile> <!-- Globbing filter -->
10          <SkipAutoProps>true</SkipAutoProps>
11        </Configuration>
12      </DataCollector>
13    </DataCollectors>
14  </DataCollectionRunSettings>
15</RunSettings>
Note the lines that exclude the Tests assemblies, the Migrations code files,
and any auto-properties.
Slick!
Bonus 1: GitHub Actions
As an added bonus, you can set up a GitHub Action to report on your code coverage on triggers of your choosing.
Here's a sample yaml file (which uses the Code Coverage Summary action - make sure to expand beyond the initial 30 visible lines to see everything):
1name: .NET Coverage
2
3on:
4 workflow_dispatch:
5 branches: [ main ]
6
7jobs:
8 build:
9
10 runs-on: ubuntu-latest
11
12 steps:
13 - uses: actions/checkout@v3
14
15 - name: Setup .NET
16 uses: actions/setup-dotnet@v3
17 with:
18 dotnet-version: 8.0.x
19
20 - name: Restore dependencies
21 run: dotnet restore
22
23 - name: Build
24 run: dotnet build --no-restore
25
26 - name: Test
27 run: dotnet test --no-build --settings tests.runsettings
28
29 - name: Publish coverage
30 uses: irongut/CodeCoverageSummary@v1.3.0
31 with:
32 filename: '**/TestResults/**/coverage.cobertura.xml'
33 badge: true
34 fail_below_min: true
35 format: markdown
36 indicators: true
37 output: both
38 thresholds: '30 60'
39
40 - name: Write to Job Summary
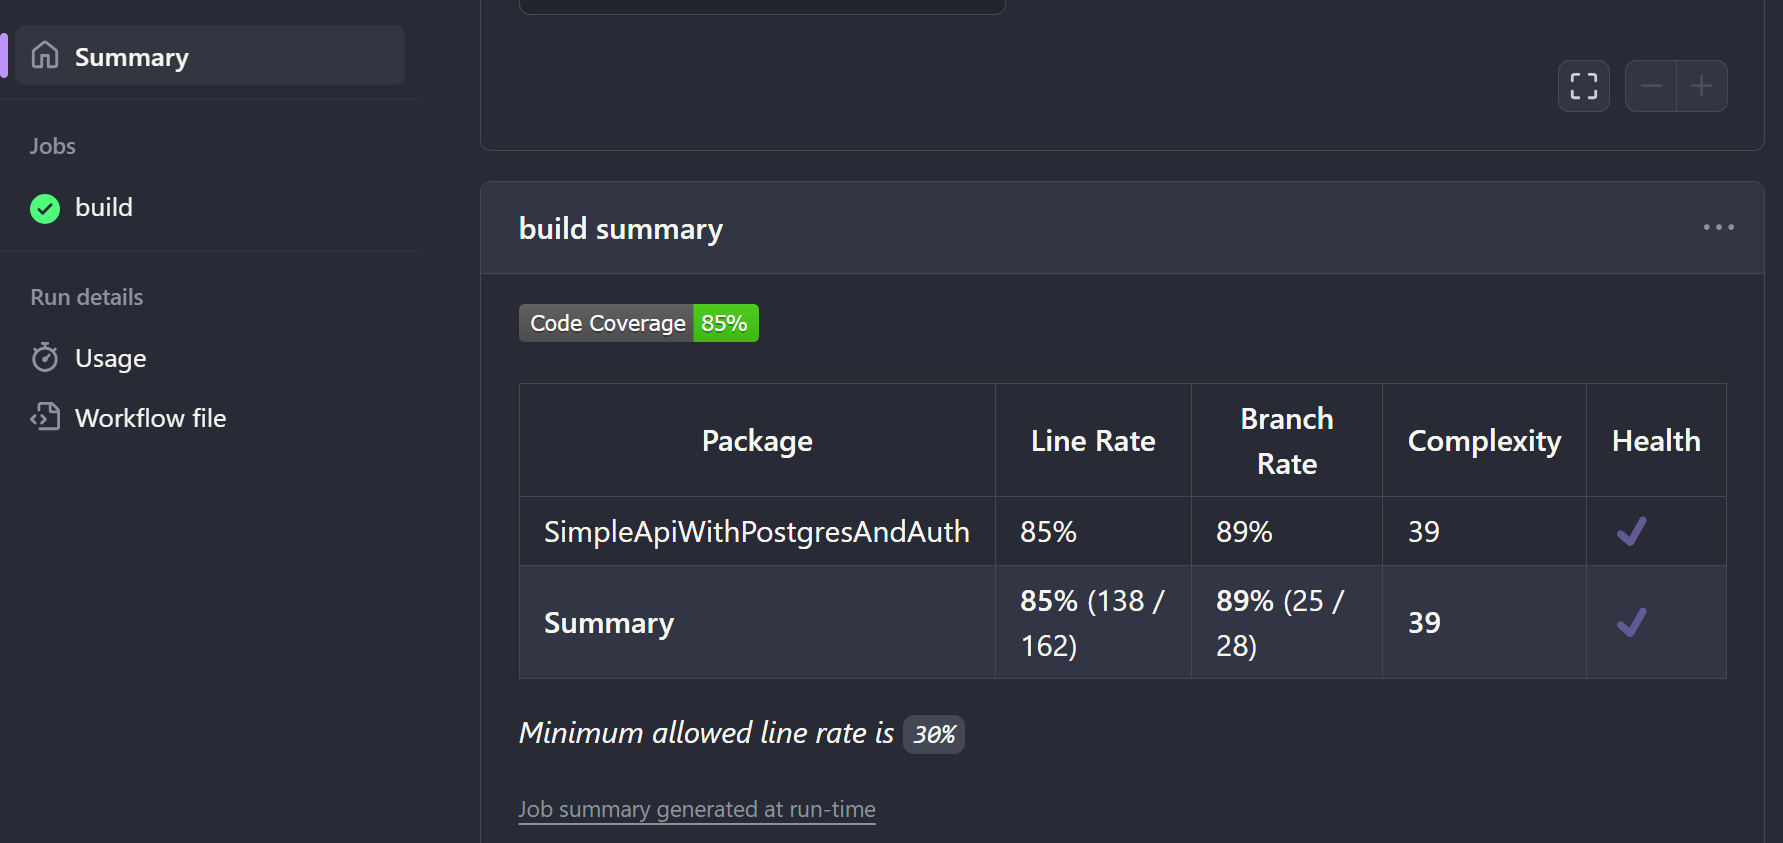
41 run: cat code-coverage-results.md >> $GITHUB_STEP_SUMMARY
The final step in the above will add to the action pipline summary as shown in this screenshot:
If you want to run this when a pull request has been created you can create a PR comment with the following step at the bottom of the action YAML:
1    - name: Add Coverage PR Comment
2      uses: marocchino/sticky-pull-request-comment@v2
3      if: github.event_name == 'pull_request'
4      with:
5        recreate: true
6        path: code-coverage-results.md
Great stuff, this!
Bonus 2: Azure DevOps Pipelines
Azure DevOps will show you a complete HTML file like the
reportgenerator one that was run locally above.
The pipeline for Azure DevOps looks something like this:
 1steps:
 2- task: UseDotNet@2
 3  inputs:
 4    packageType: 'sdk'
 5    version: '8.0.x'
 6
 7- task: DotNetCoreCLI@2
 8  displayName: 'Run tests'
 9  inputs:
10    command: 'test'
11    arguments: '--settings Tests/tests.runsettings'
12    publishTestResults: true
13
14- task: PublishCodeCoverageResults@2
15  displayName: 'Publish code coverage: Azure DevOps'
16  inputs:
17    codeCoverageTool: 'Cobertura'
18    summaryFileLocation: '$(Agent.TempDirectory)/**/*cobertura.xml'
Then when your pipeline runs you should have a Code Coverage tab
on the pipline results.
Happy coding and testing!