Quick Analysis of Web Logs (IIS or nginx) With the ELK Stack
"Show me some stats!!"
Recently I was trying to get some quick-and-dirty analysis of an API-based website done. The site was written in PHP and running under nginx on multiple Linux boxes (load-balanced).
I wanted to be able to answer questions like this:
- How many hits per day is the API getting hit?
- What is the breakdown of non-200 statuses?
- Which API methods are hit the most?
- Are there times of day (or days of week) when the API is hit hardest?
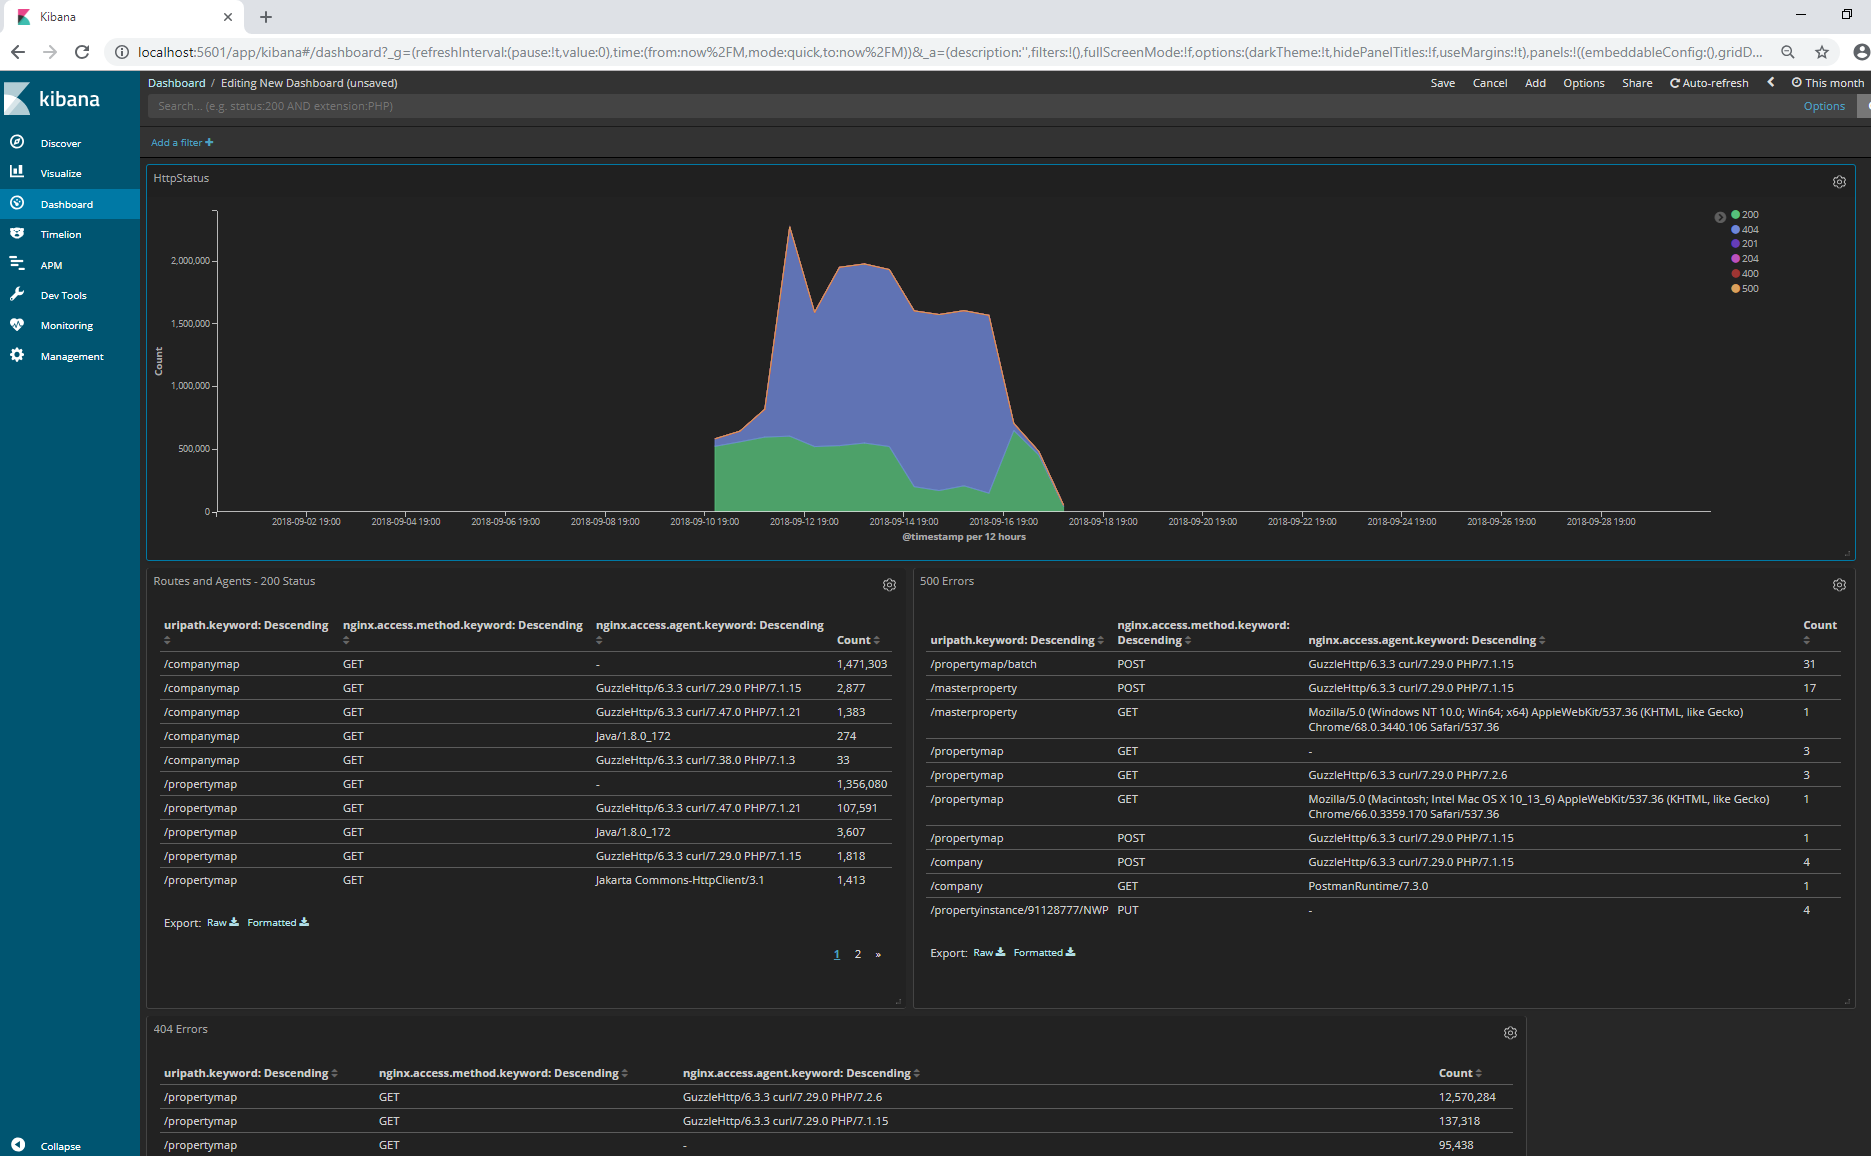
I have used the ELK stack (Elasticsearch / Logstash / Kibana) for things like this in the past (never just ad-hoc tho), and wanted to give it a go. I’m happy to report that I had great success, as shown by the following dashboard – that was available after about an hour’s worth of time spent.
What was involved?
The basic things I needed to make this happen were as follows:
- Docker Desktop running locally on my Windows box
- Docker image for the ELK stack
- nginx web log files accessible to me (I put copies on my Windows box)
- A
conffile that was fed into the ELK container’s Logstash instance
Setting it up
Assuming you have Docker installed on your machine (you can get it from here if you don’t have it already), you need to obtain a container running the ELK stack. While there are a few choices, the popular sebp/elk image is the one that I used.
From an admin terminal, run the following:
1docker pull sebp/elk
The next thing you need to do is note where your (unzipped) log files are.
Assuming that you know that, you need to create a conf file — this is just a text file named something-you-choose.conf.
That file will be used to configure logstash at the startup of the container. I’ll show my file here, then add some explanation below.
 1input {
 2    file {
 3        path => '/nginx-data/*/access*'
 4        start_position => 'beginning'
 5    }
 6}
 7filter {
 8    grok {
 9        match => { "message" => ["%{IPORHOST:[nginx][access][remote_ip]} - %{DATA:[nginx][access][user_name]} \[%{HTTPDATE:[nginx][access][time]}\] \"%{WORD:[nginx][access][method]} %{DATA:[nginx][access][url]} HTTP/%{NUMBER:[nginx][access][http_version]}\" %{NUMBER:[nginx][access][response_code]} %{NUMBER:[nginx][access][body_sent][bytes]} \"%{DATA:[nginx][access][referrer]}\" \"%{DATA:[nginx][access][agent]}\""] }
10        match => { "message" => ["%{IPORHOST:[nginx][access][remote_ip]} - %{DATA:[nginx][access][user_name]} \[%{HTTPDATE:[nginx][access][time]}\] \"%{WORD:[nginx][access][method]} %{DATA:[nginx][access][url]}\" %{NUMBER:[nginx][access][response_code]} %{NUMBER:[nginx][access][body_sent][bytes]} \"%{DATA:[nginx][access][referrer]}\" \"%{DATA:[nginx][access][agent]}\""] }
11    }
12    urldecode {
13        field => "[nginx][access][url]"
14    }
15    grok {
16        match => { "[nginx][access][url]" => ["%{URIPATH:uripath}"] }
17    }
18    mutate {
19        add_field => { "read_timestamp" => "%{@timestamp}" }
20    }
21    date {
22        match => [ "[nginx][access][time]", "dd/MMM/YYYY:H:m:s Z" ]
23        remove_field => "[nginx][access][time]"
24    }
25    useragent {
26        source => "[nginx][access][agent]"
27        target => "[nginx][access][user_agent]"
28    }
29}
30output {
31  elasticsearch {
32    hosts => localhost
33    manage_template => false
34    index => "logs-%{+YYYY.MM.dd}"
35  }
36}
The input block is important, and will be used to point to the files you make available to your container (see below). I’ve specified the /nginx-data/ path totally arbitrarily, but my files in the directory I’m going to make available are like this:
- 001\access.log-{date}
- 002\access.log-{date}
- {..etc..}
That’s why I used the wildcard-type expression you see in the path line at the top.
In the first grok block (see what I did there?? 🙂 ), there are two lines that basically are telling logstash how to parse each line in my nginx log files. In the SECOND grok block, I’m trying to get everything up to but not including the querystring from the URL of the request and call that the uripath field in the output.
The last thing to note about this file is that I’m pushing events to the logs-{date} index — you can see this in the output block at the bottom of the file. This will become important when we open Kibana for the first time.
For more information about logstash configuration files, see the excellent documentation: https://www.elastic.co/guide/en/logstash/current/config-examples.html
Running the container
We need to mount two volumes when we run the container, one to provide the CONF file that we created, and one that will point to the directory with our nginx logfiles.
Here’s the command to run it — execute from PowerShell admin prompt:
1docker run -p 5601:5601 -p 9200:9200 -p 5044:5044 -v C:\users\edahl\Downloads\prd_api\logs:/nginx-data -v c:\users\edahl\Documents\elk-nginx\nginx.conf:/etc/logstash/conf.d/nginx.conf -it --name elk sebp/elk
Yes, that’s a mittful of a command. There are two -v args, and each represents a volume mount that we are doing. The first part is the Windows path to what we want to make available (your path will be different than mine), and the part after the colon is the path inside the container where the contents will be (you can probably use the same values as mine for those).
The rest are the standard args for this container – and they are pretty well described here if you need more info.
Note that the command above will run the container in “interactive” mode — the -it param — so that you can see info as it occurs in the container. If you Ctrl-C or close the window where you ran the command the container will stop.
What if you screwed something up?
If something went wrong, of if your conf file wasn’t quite right, that’s OK. It’s easy to start again. Ctrl-C the running container and it will stop. Then do the following to be able to see the id of the container you just stopped:
1docker ps -a
After that, do the following with the first three letters of your container id (or the whole thing) to remove the container itself:
1docker rm 7xf -- (or whatever your three letters are)
Then fix whatever needs fixing, and re-run the docker run command from above. Iterate as necessary. 🙂
Getting into Kibana
To access Kibana, you will open a browser and go here:
You’ll need to establish your index within Kibana first, and you can do this from Management->Index Patterns. You’ll want to use the same index pattern you specified in the output node of the conf file.
Once you’ve done that, you should be able to "Discover" some data, and add the Visualizations and Dashboards you want.
If you want to know more about Discovery, Visualization, and Dashboards, about 15 minutes from a course I did on Pluralsight will probably help you — specifically check out the "Choosing the Right Sink to Enable Analysis" and the following three clips:
- Configuring Index Patterns with Kibana
- Log 'Discovery' with Kibana
- Log 'Visualization' and 'Dashboards' with Kibana
Here’s the course: https://app.pluralsight.com/library/courses/dotnet-logging-using-serilog-opinionated-approach/table-of-contents.
Happy analyzing!